
The Defender Board
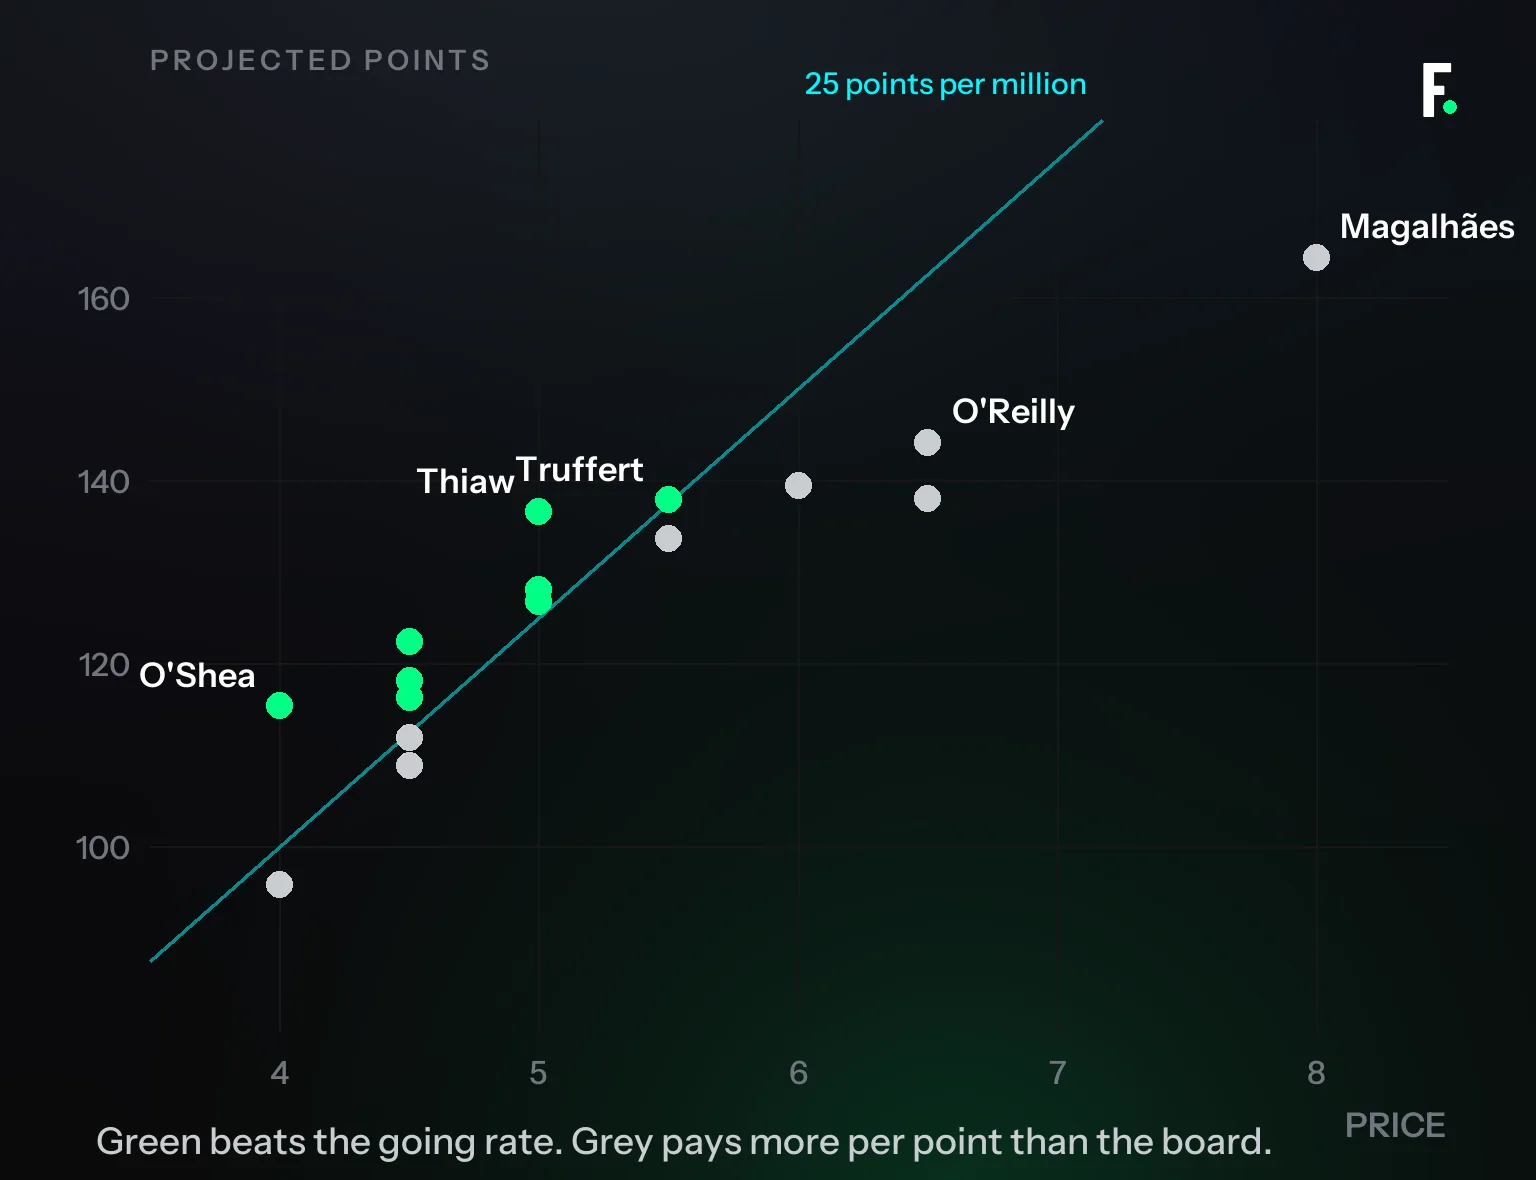
What the model expects from every Premier League defender this season, and what you pay for it. Gabriel is projected to score the most points and to be the worst value on the board.

Updated

This is a forecast, not a record of last season. Every number below is the model's expectation for the 38 gameweeks ahead: it prices each fixture, the chance the player starts it, the minutes he plays, and every scoring line including the defensive contribution.
Two columns matter and they disagree. Projected points tells you who scores most. Points per million tells you whether the money is better spent elsewhere. Gabriel outscores O'Shea by 49 points across the season and costs twice as much to do it.
| Projected | Per million | |
|---|---|---|
| Gabriel Magalhães, Arsenal, 8.0 | 164.4 | 20.5 |
| Dara O'Shea, Ipswich Town, 4.0 | 115.4 | 28.8 |
The whole board is that argument drawn once. Value is a straight line through the origin, and a defender is a good buy or a bad one by which side of it he sits on.
Best value, 2026/27 projections
| # | Player | Club | Price | Projected | Per million | Start prob | From defensive contribution |
|---|---|---|---|---|---|---|---|
| 1 |  Dara O'Shea Dara O'Shea |  Ipswich Town Ipswich Town | 4.0 | 115.4 | 28.8 | 0.85 | 24% |
| 2 |  Malick Thiaw Malick Thiaw |  Newcastle Newcastle | 5.0 | 136.6 | 27.3 | 0.86 | 14% |
| 3 |  Ferdi Kadıoğlu Ferdi Kadıoğlu |  Brighton Brighton | 4.5 | 122.4 | 27.2 | 0.91 | 4% |
| 4 |  Antonee Robinson Antonee Robinson |  Fulham Fulham | 4.5 | 118.2 | 26.3 | 0.79 | 12% |
| 5 |  Calvin Bassey Calvin Bassey | Fulham | 4.5 | 116.3 | 25.8 | 0.88 | 14% |
| 6 |  Mats Wieffer Mats Wieffer | Brighton | 5.0 | 128.1 | 25.6 | 0.87 | 16% |
| 7 |  Harry Maguire Harry Maguire |  Man Utd Man Utd | 5.0 | 126.8 | 25.4 | 0.81 | 17% |
| 8 |  Adrien Truffert Adrien Truffert |  Bournemouth Bournemouth | 5.5 | 137.9 | 25.1 | 0.91 | 16% |
| 9 |  Timothy Castagne Timothy Castagne | Fulham | 4.5 | 112.0 | 24.9 | 0.84 | 9% |
| 10 |  James Hill James Hill | Bournemouth | 5.5 | 133.7 | 24.3 | 0.90 | 31% |
| 11 |  Vitalii Mykolenko Vitalii Mykolenko |  Everton Everton | 4.5 | 108.9 | 24.2 | 0.89 | 14% |
| 12 |  Leif Davis Leif Davis | Ipswich Town | 4.0 | 95.9 | 24.0 | 0.78 | 3% |
Filtered to a start probability of 0.70 or better, because a cheap defender who does not play is worth nothing. Every player here carries full model confidence in all 38 gameweeks.
The last column is the interesting one
Two defenders can project almost identically and be completely different assets. Compare James Hill, who takes 31% of his points from the defensive contribution, with Nico O'Reilly, who takes 3%.
Hill's points arrive steadily, a couple most weeks, and barely depend on Bournemouth keeping a clean sheet. O'Reilly's arrive in lumps: 49 of his 144 projected points come from goals and assists. Same board, opposite shapes.
Buy the defensive contribution when you want a defender you can stop checking. Buy the attacking full-back when you need the weeks that move a rank.
What 3.0 actually buys
Gabriel projects 164.4 points. Malick Thiaw at 5.0 projects 136.6. The upgrade costs 3.0 for 28 points, which is 9.3 points per million spent, against a board where the going rate is roughly 25.
That is the case against the premium defender, and it is not that he is bad. He is the highest projected scorer in the position. It is that the same 3.0 moved into your forward line buys considerably more.
Highest projected totals
| Player | Club | Price | Projected | Per million | Start prob |
|---|---|---|---|---|---|
 Gabriel Magalhães Gabriel Magalhães |  Arsenal Arsenal | 8.0 | 164.4 | 20.5 | 0.84 |
 Nico O'Reilly Nico O'Reilly |  Man City Man City | 6.5 | 144.2 | 22.2 | 0.87 |
 James Tarkowski James Tarkowski | Everton | 6.0 | 139.5 | 23.3 | 0.90 |
 Virgil van Dijk Virgil van Dijk |  Liverpool Liverpool | 6.5 | 138.1 | 21.2 | 0.87 |
| Adrien Truffert | Bournemouth | 5.5 | 137.9 | 25.1 | 0.91 |
| Malick Thiaw | Newcastle | 5.0 | 136.6 | 27.3 | 0.86 |
| James Hill | Bournemouth | 5.5 | 133.7 | 24.3 | 0.90 |
Truffert and Thiaw appear on both boards. They are the only defenders projected above 130 points who are also above 25 per million.
If you take three things from this
Thiaw at 5.0 and Truffert at 5.5 are the two names on both lists. High totals and high value, with start probabilities of 0.86 and 0.91, which is as close to nailed as a projection gets.
At 4.0, O'Shea is the best value in the position, and he is a genuine playing defender rather than bench filler, which is rare at that price.
Gabriel is a fine footballer and an expensive way to score defensive points.If your team is tight, he is the first place to look for the money.
Centre-back or full-back, at every price
Since the last column is doing so much work, here is the whole board cut by role and price. Every defender the model can classify, projected forward.
| Price and role | Players | Avg projected | Per million | Start prob | Defensive contribution | Clean sheet | Attack |
|---|---|---|---|---|---|---|---|
| 4.5 centre-back | 14 | 81.5 | 19.2 | 0.68 | 18% | 26% | 10% |
| 4.5 full-back | 18 | 94.1 | 21.5 | 0.79 | 8% | 29% | 14% |
| 5.0 centre-back | 21 | 100.6 | 20.1 | 0.69 | 20% | 25% | 13% |
| 5.0 full-back | 5 | 96.6 | 19.3 | 0.72 | 8% | 28% | 16% |
| 5.5 centre-back | 8 | 104.7 | 19.0 | 0.72 | 19% | 29% | 10% |
| 5.5 full-back | 6 | 111.3 | 20.2 | 0.76 | 10% | 31% | 14% |
| 6.0+ centre-back | 7 | 120.5 | 18.9 | 0.71 | 17% | 29% | 13% |
| 6.0+ full-back | 2 | 121.7 | 19.4 | 0.81 | 5% | 29% | 24% |
Composition columns are the share of each group's projected points from that line. They do not sum to 100 because appearance points, goals conceded, cards and bonus make up the rest. Filtered to a start probability of 0.50 or better.
Three things fall out of that table.
Value is flat again. Every cell sits between 18.9 and 21.5 points per million. Neither role nor price gives you an edge on price alone, which is exactly what the market should look like and exactly why the choice has to be made on something else.
At 4.5 the full-back is the better bet, and the reason is minutes. He projects 94.1 against 81.5, and the gap is not talent. His start probability is 0.79 against 0.68. Cheap centre-backs are rotation fodder more often than cheap full-backs are, and a defender who does not play scores nothing at any price.
The composition never converges. At every price a centre-back takes roughly twice as much of his total from the defensive contribution, and a full-back takes more from attack. At 6.0 and up the split is starkest: 5% against 17% on the defensive line, 24% against 13% on the attacking one.
You are not picking a better defender. You are picking which line your points arrive on, and whether the man is going to be on the pitch to earn them.
What this is, and what it is not
The model prices every fixture from a goal model fitted to shot quality and market odds, then converts that into each scoring line: appearance, clean sheet, goals conceded, goals, assists, cards, bonus and the defensive contribution. It reprices whenever team news lands.
All 38 gameweeks are projected for every player, across 599 players, with no low confidence gameweeks among the players named here. Last recomputed 21 August.
Three limits on all of it:
- No matches have been played. These are preseason projections, and the first three gameweeks will move them more than anything else this season.
- Start probability is the weak point of any preseason model. A projection of 0.90 is a judgement about a manager, not a measurement. Treat the totals as conditional on the player keeping his place.
- Promoted clubs carry the most uncertainty. A club with no recent Premier League record rests on a shorter history than the rest of the board.
Read next

Gameweek 3: Where the Points Are
Seven games, and the cheapest good ones are at the bottom of the table. Who to pick in each, and the popular names our numbers do not back.